Lab reports turned into tables and trends
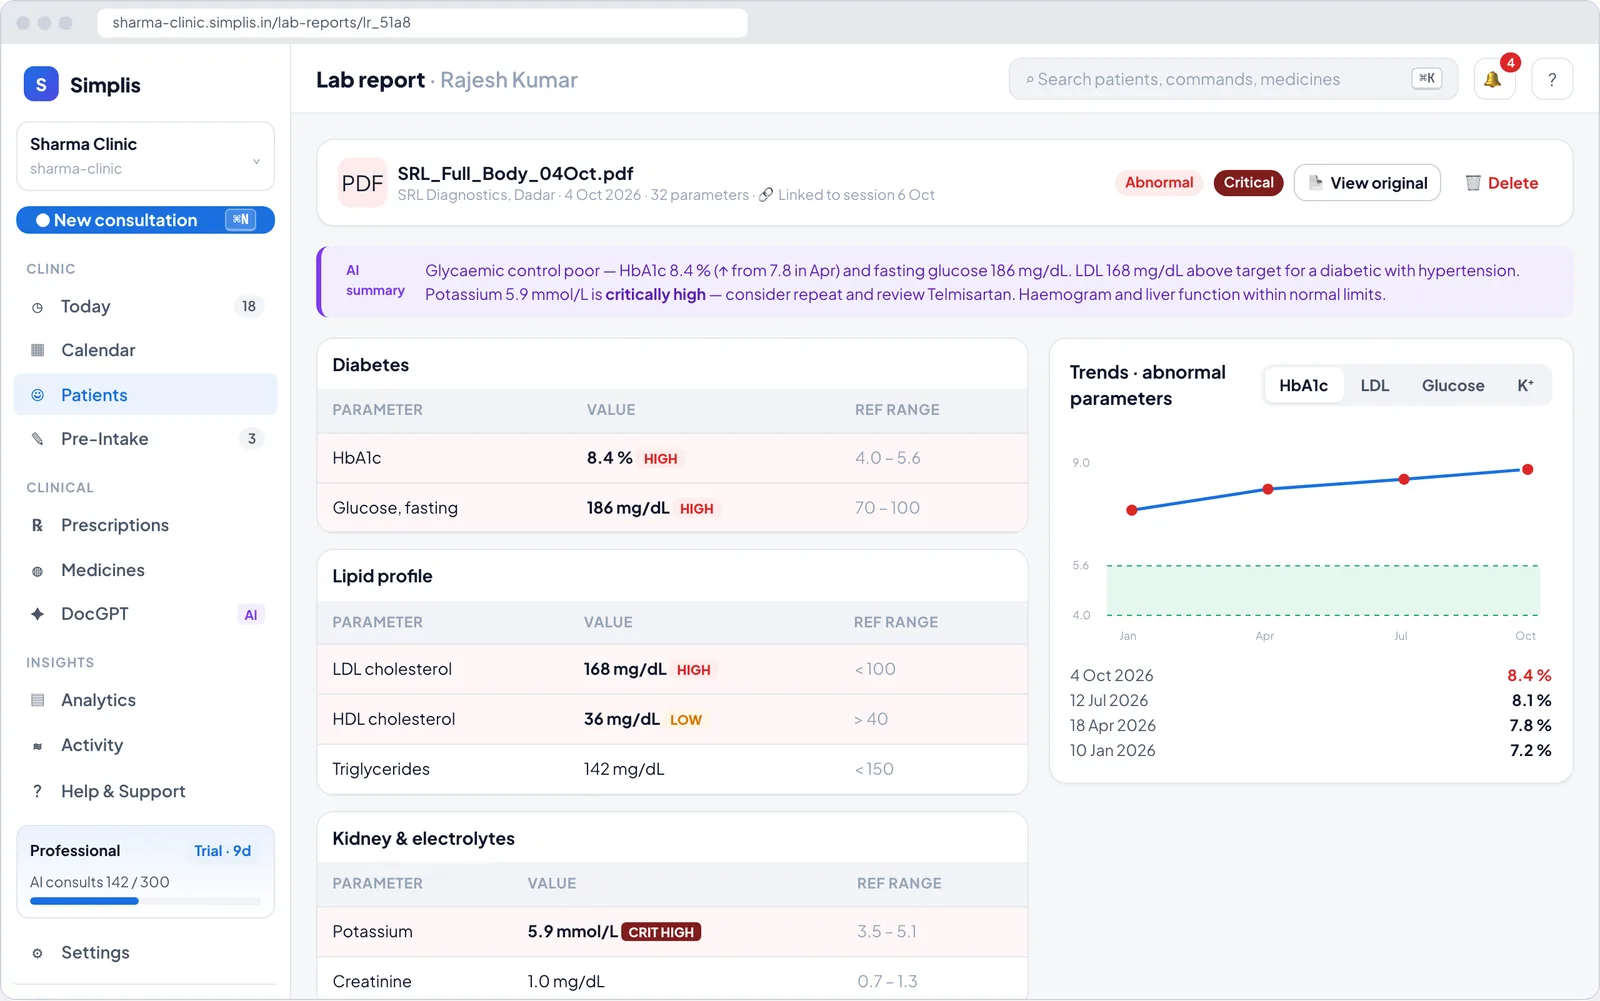
Patients bring reports on paper, as PDFs and as WhatsApp photos. Upload them to the patient’s record and Simplis extracts each parameter with its reference range, flags what is out of range, and charts it against earlier reports.
Your data is not for sale. Never sold or shared with pharma, marketers or data brokers. How we handle data
What you get
Lab report AI in Simplis
PDF or photo
Upload the lab’s PDF or snap the printed report with your phone camera.
Grouped parameters
Diabetes, lipid profile, kidney function and more appear in grouped tables with units and reference ranges.
Out-of-range flags
High, low and critical values are highlighted so they are hard to miss.
Trends across visits
Follow HbA1c, LDL, creatinine and other values over months on a simple chart.
Order investigations
Add lab orders from the consultation with instructions such as fasting, and save common panels.
How it works
In your clinic, step by step
- 1
Upload
Attach the report to the patient’s Lab works tab.
- 2
Extract
Simplis reads the values and reference ranges.
- 3
Review
Check the extracted values against the original.
- 4
Track
Trends update with every new report.
Popular with
FAQ
Lab report AI: common questions
Do I need to check the extracted values?
Yes. Extraction is assistive — the original report stays attached so you can compare before relying on any value.
Which labs are supported?
Simplis reads standard printed and PDF reports; it does not depend on a specific lab’s format.
Related features
AI clinical notes
Talk to your patient as usual. Simplis drafts structured SOAP notes for you to review and approve.
Learn more →Analytics & DocGPT
See patients, revenue and diagnoses at a glance, and ask questions about your clinic data in plain English.
Learn more →Pre-intake by nurse
Your nurse or assistant records vitals and the patient’s story before the patient reaches your table.
Learn more →
Try lab report ai in your OPD
Set up in minutes with your specialty template. First month free — ₹0 today.